

By Mark Semmelmayer, CBC
Chief Idea Officer
Pen & Inc. Marketing Communications
Mark Semmelmayer prefaces a year-on-year comparison of Gardner Business Media’s annual report, Media Usage in Manufacturing, conducted in 2015 and 2016, providing you with a better picture of your customer and insights into changing trends that will shape the future of B2B marketing.
For a sixth year, Gardner Business Media has released its annual Media Usage in Manufacturing study. Last year, I compared 2014 to 2015. I thought you might again find it useful to have a year-on-year comparison.
More than 1600 respondents covered the spectrum of manufacturers, from automotive to medical, defense, machinery, and consumer goods. 48% represented plants with 100+ employees, 24% had fewer than 50.
This year, some changes are notable. There’s a double meaning to the Bob Dylan reference. He wrote that song about the baby boomers coming of age. Even if the boomers’ successors don’t know the song, their weight in industrial buying decisions is on the rise.
A Comparative Overview
- Some things never change
It makes no difference the media or channel used. Brand is the most influential factor in vendor evaluation. Brand impact shows in the way buyers search, visit websites, consume product or technical information, or even notice ads. Recognizable brands overwhelmingly get first.
- But vendor selection criteria and buying teams are
In this area, important data has changed year-on-year:
- The most influential criteria in selection are service, followed by technology and price. Last year, the top three were, in order, technology, service and reputation.
- There’s a disconnect in suppliers’ messaging. Most vendors’ marketing communications focus on technology and performance. The new emphasis of the buyer on value . . . service and price . . . might warrant a change to more value oriented brand messages.
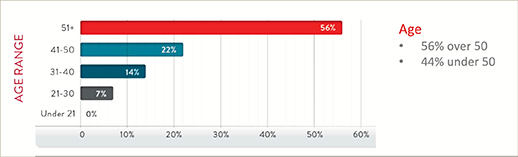
- Buyers in age of 51+ dropped to 56%, a year-on-year drop from 65%. Significant.
- Buyers aged 21-30 years increased from 4-7%.
- Buyers under the age of 50 now represent 44% of respondents.
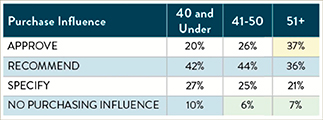
- Buyers who said they held a corporate management position grew from 20% to 26%.
- 37% had an engineering title, and we know what they eat. Data! That’s your content strategy.
- Search and Web Use
- Search engines remain an essential research component for buyers.
- 93% of buyers are most likely to select search returns featuring known companies and brands.
- SEO (Search Engine Optimization) strategies are essential to get you ranked higher in search results. Buyers don’t trust paid search ads.
- The dependence on web search demands a balance of “push” media (advertising, trade shows) and “pull” media (your website, your search results) for best results.
- The most powerful ways to build brand are through “push”, print advertising and event display.
- As you build the brand, your website and content marketing “pull” channels become essential.
- Media
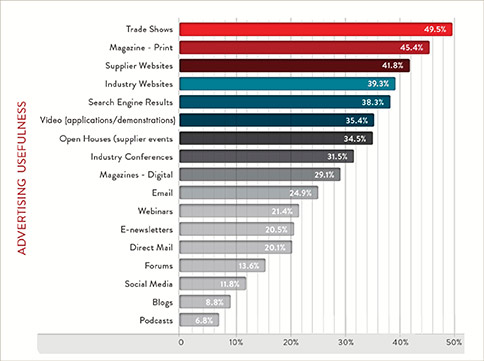
- This year, trade shows supplanted trade print as a buyers “go to” resource; Tradeshows, at 49.5%, outscored Trade Magazines at 45.4%.
- The next 3 trusted information resources were: Supplier Websites, 41.8%, Industry Websites, 39.3% and Search Engine Results, 38.3%.
- No other digital sources (digital magazines, e-newsletters, etc.) made it past 30%.
- The big surprise was a drop in webinars use, 54% last year plunging to just 21.4% this year.
- Social Media
- Social media adoption increased about 1% from 2015; perception of usefulness remains poor.
- LinkedIn and YouTube continue to be the most useful social media sites for business.
- Digital/social adoption has increased for 5 years running. It now needs to be part of your marketing strategy.
- Mix in social, but as a complement to, not as a replacement for, any of your other efforts.
An important note for use of social media: Buyers do not expect to be contacted after engaging in non-registration digital transactions.
Trend Watch: Implications of the 2016/2017 Survey for Marketers
- Buyer Profile
50+ buyers dropped 9% from the previous survey. I believe that is the start of a significant trend. Coupled with an increase in respondents identified as corporate management, and a 3-5 member buying “team,” it seems marketers need to bolster their marketing at the C-Suite level, and start on a marketing path more impactful for younger buyers.
As the survey put it; “Senior level professionals still drive purchasing decisions. But, industrial marketers should be laying a foundation for the next generation. Much like their predecessors and mentors, the next generation is conditioned by push media and captured by pull media.”
- Search and Web Use
Brand presence is the Mac Daddy in getting web views. Searchers usually go to supplier websites they recognize. Keeping websites brand-consistent, up-to-date, user friendly and loaded with product/technical information is key. Investment in search marketing, especially Search Engine Optimization (SEO), for your website, is critical, because buyers prefer organic search results over paid search results.
- Media
“Push” media is still tops, but “Pull” media influence continues to grow. As buyers’ information channels proliferate and evolve, a 3600 view of your marketing efforts is critical. That’s Integrated Marketing Communications (IMC). In a nutshell, IMC is:
- Completely understanding your audience, their habits and needs. It’s not about what you sell, but what the customer wants.
- Crafting compelling brand messages, appropriate to the selected media/channel.
- Delivering messages when, where and how customers want it. (This is where engaging younger buyers needs to be addressed).
- Establishing plans to measure response and using results to craft the next plan.
Also, an increasing preference for trade shows, as a resource, may signal a need to update your trade show strategy.
- Messaging
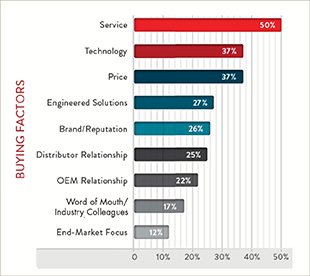
As the survey report said, “Buyers want benefits! When evaluating vendors and considering purchases, buyers place a premium on service.” After service, the next two attributes are technology and price. Technology is logical, because of the influence of engineers on the buying team. Price is making its first appearance in the top 3 difference makers.
This is a big change. Last year, the top three were, in order, technology, service and reputation. Supplier marketing communications traditionally focus on technology and performance. As you roll toward your next marketing campaign, you’ll probably want to orient your messages more in line with buyers “wants.” The report put it this way: “There is opportunity to evolve messaging by incorporating service and user benefits into brand and demand based marketing.”
- Social Media
Where the industrial buyer is concerned, social media is down the list in terms of influence. But, you’d be wrong to ignore it. It has some value to buyers in their product investigations (and younger influencers are heavier social users). If you don’t have a social media strategy, start developing one. Focus on what it provides: a way of deepening interaction with possible customers. Keep your social strategy simple and focused on the apps, like LinkedIn and YouTube that are meaningful now.
Need more information?
Mark Semmelmayer, CBC
Chief Idea Officer
Pen & Inc. Marketing Communications
Marietta, GA
770-354-4737
LinkedIn
 MARK SEMMELMAYER is a former Chairman of the Business Marketing Association (BMA) and President of the BMA’s Atlanta Chapter. Recipient of the 2015 G. D Crain Award from BMA and an Inductee in the Business Marketing Hall of Fame, Mark’s a 40-year B2B marketing veteran, including 32-years with Kimberly-Clark. He is the founder and Chief Idea Officer of Pen & Inc. Marketing Communications, a consultancy in Atlanta, GA.